lightcurves
Looking for GRB follow-up & afterglows?
Documentation on the real-time follow-up campaign overview, automatic
AI parsing of NASA GCN circulars, afterglow fitting and
extrapolation, observatory registration, observation reports, and
CSV/VOTable downloads is available at the dedicated
GRB Follow-up & Afterglows page.
We query the following data sources to compile the lightcurves of
optical transients (introduced with v2.15.0): - Asteroid Terrestrial-impact Last Alert System (ATLAS)
- ASAS-SN
- Fink broker (access to data from the Zwicky Transient Facility (ZTF) and Rubin Observatory's Legacy Survey of Space and Time (LSST))
- American Association of Variable Star Observers (AAVSO)
- Réseau Amateur Professionels pour les Alertes Scientifiques (RAPAS)
We search for the nearest source around the selected event and retrieve all available photometric observations. ZTF and LSST observations are retrieved via the Fink broker and include all available data, i.e. we do not limit ourselves to the Fink data quality criteria. It should be noted that ASAS-SN provides the raw photometric values at the location of sources in the ASAS-SN catalog while ZTF/LSST/Fink and ATLAS provide difference magnitudes after subtracting archival measurements. In general this means that ASAS-SN provides combined measurement of the host galaxy and the transient, while the other observatories provide direct measurements of the luminosity of the transient event.
AAVSO photometry is limited by default to the most common filtered and calibrated bands (
B,
V, R, I, and CV).
Customized lightcurves can request all other AAVSO filters, including
visual estimates (Vis.). Finally, we apply filters to the
data points of all observatories to remove entries with (mag < 0.1) as
well as entries with large uncertainties (mag_err> 0.5). ATLAS
measurements are combined into intervals that are 90 minutes long. The
original measurements are shown with semi-transparent markers. ZTF and
LSST data flagged by the Fink broker as 'bad quality' are also shown
in the same way. Upper limits are shown as downward facing triangles.
The resulting figure shows all selected datapoints. The X-axis of the
figure is rescaled to match this data range and therefore does not
necessarily correspond to the user-defined time range. An example of
the resulting lightcurve figure is shown here: 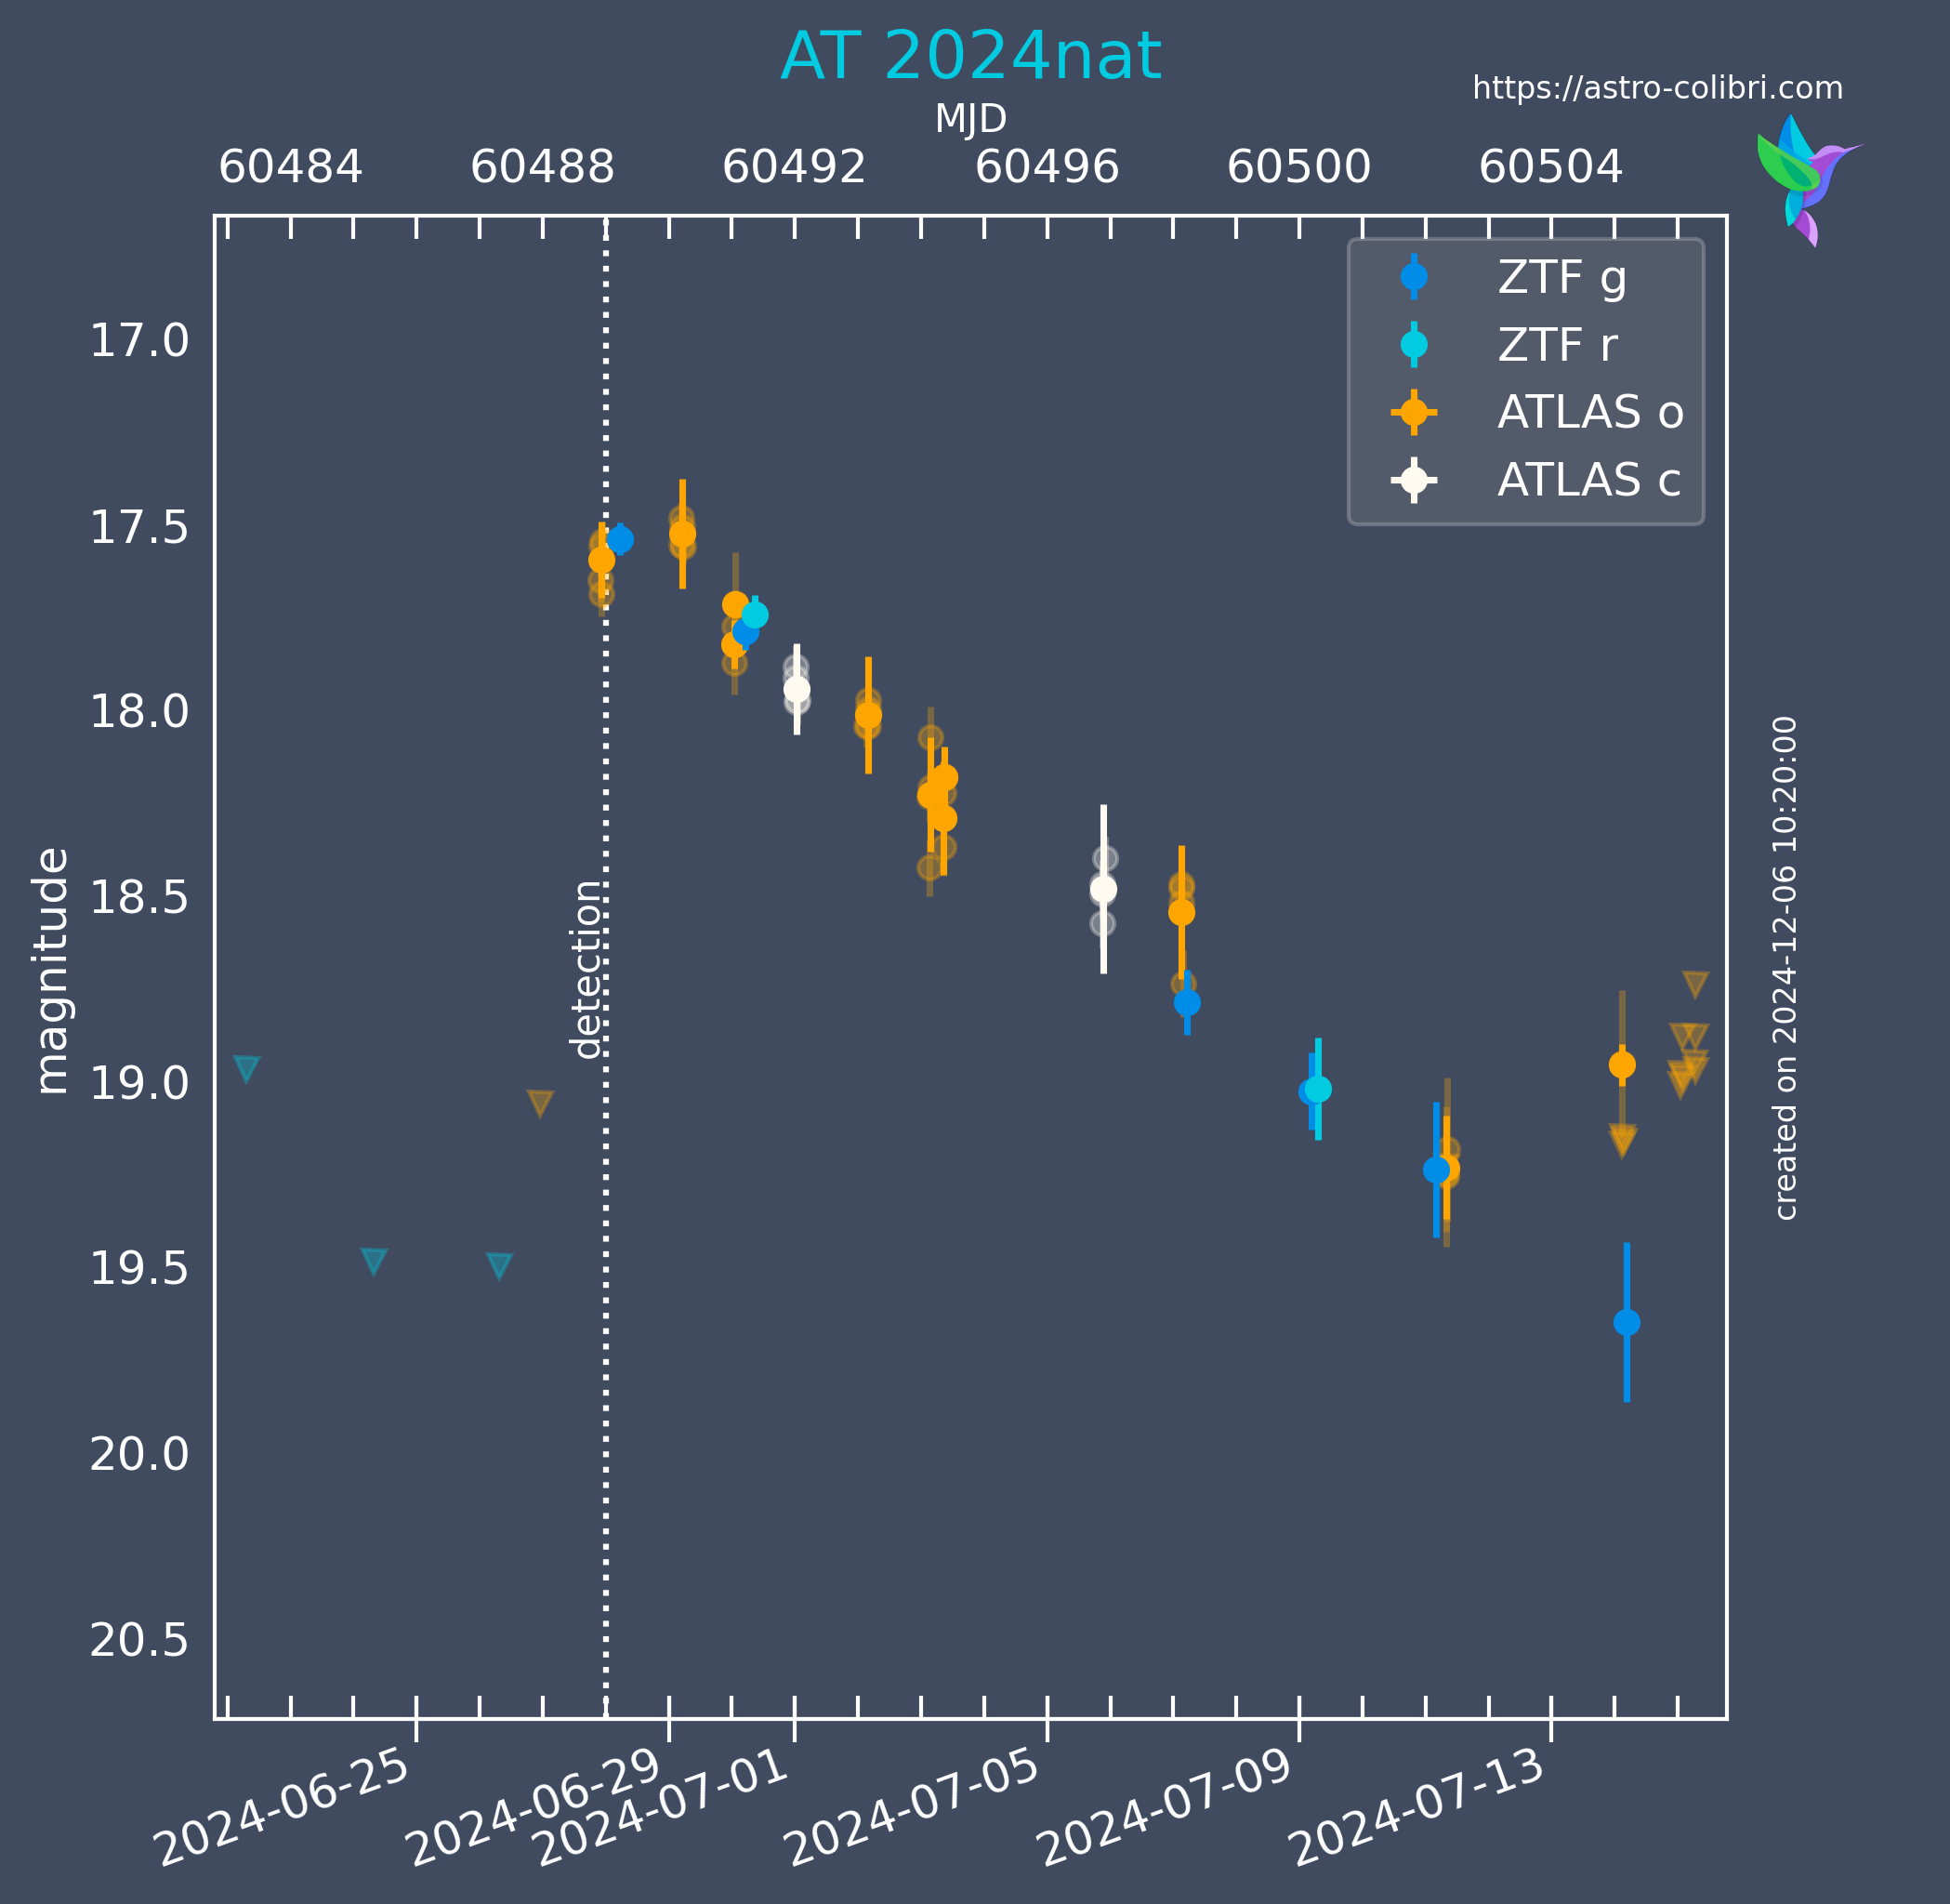
Default lightcurves for optical transients (including all un-classified ones) detected in the last 15 days are updated once per day. All classified transients (independent of the classification, i.e. SNe, TDE, CVs, etc.) detected over the last 50 days are also updated each day. Special, nearby supernovae are updated daily for a full year. The selection is requiring the redshift to be known and to be smaller than 5% of all events with the same SN type (1% for SN Ia and SN II). The lightcurves cover 5 days before the detection of the transient and up to the day of their update. The date of the creation of the figure is given on the figure for reference. Users can create customized lightcurves by opening the small menu indicated by the downward facing arrow (in Science mode). The user can then select the desired time range and (if sufficient access rights exist) add or remove data from observatories and amateur astronomer networks. The name of the lightcurve contains all data sources requested for its creation.
GRB optical afterglow lightcurves
GRB events can also include an optical-afterglow context figure based on photometry extracted from NASA GCN circulars, comparing them on top of archival measurements. To view the extensive details on GRB optical afterglow lightcurves, including mathematical models (simple power-law, smoothly broken power-law / Beuermann function), fitting and extrapolation options, observatory registration, observation reports, and details of the CSV and VOTable downloads, please refer to the dedicated GRB follow-up & afterglow documentation.Photometric Summary
We provide key photometric data for each event, including the time, magnitude, and magnitude error for each filter and telescope (ATLAS, ASAS-SN, AAVSO, ZTF, and LSST) if available. Thefirst observation is defined as the earliest measurement
at or after the TNS detection time (i.e., the official event report
time, with a 12-hour window included to ensure better coverage). The
peak observation corresponds to the measurement of
highest brightness (i.e., the lowest magnitude value in the light
curve), and the last observation is the most recent entry
in the telescope catalog. These data points serve as sub-filters,
enabling users to identify rapidly rising or fading transients, filter
events by the last magnitude value, or select events within a specific
time window relative to the first, peak, or last observation. These
features are available in the latest_transients and
cone_search endpoints, both in the API and the frontend
interface.
We also display lightcurve slopes:
Rising (from first to
peak observation) and Fading (from peak to last
observation), which help users quickly characterize transient
behavior, understand the evolution of the event over time, and
visualize how the filters work. We require the measurement with the
same filter to be taken at least 12 hours apart to calculate the
slopes.
Download Full Photometry Dataset
Alongside the lightcurve figure and the condensed photometry information, a CSV file is available for download. This file contains the full dataset of photometric measurements used to generate the lightcurve figure. Each row corresponds to an individual observation and includes information such as the observation time (in both UTC and MJD formats), the filter used (e.g.,ztf_g,
lsst_g, atlas_o, aavso_V), the
measured magnitude and its uncertainty, and the source of the data
(ATLAS, ZTF, LSST, AAVSO, or ASAS-SN). A flag column is
also included to indicate the quality or type of each measurement. For
instance, ATLAS data may be marked as original or
average depending on whether it comes directly from the
catalog or is averaged across 90min intervals. These averaged values
also include the uncertainty in the time. All values can also carry an
ul flag to denote upper limits. In the case of ZTF, LSST,
AAVSO, and ASAS-SN, the flag may be good,
bad, or ul (for upper limits), allowing
users to further filter or interpret the data. If the measurement does
not have a valid uncertainty associated with it, the entry is flagged
as magerr_missing.
Filter Abbreviations
The lightcurve legend uses easy readable labels such asZTF r, while the CSV file stores the same filter with a
data-source prefix, for example ztf_r. The suffix
identifies the photometric band or passband:
| CSV filter name | Legend label | Description |
|---|---|---|
atlas_c, atlas_o |
ATLAS c, ATLAS o |
ATLAS cyan and orange wide survey filters (cyan, orange). |
ztf_g, ztf_r, ztf_i
|
ZTF g, ZTF r, ZTF i
|
Zwicky Transient Facility optical g,
r, and i filters (IRSA ZTF documentation).
|
lsst_u, lsst_g, lsst_r,
lsst_i, lsst_z, lsst_y
|
LSST u, LSST g, LSST r,
LSST i, LSST z, LSST y
|
Rubin/LSST broadband filters, ordered from near-ultraviolet to
near-infrared as ugrizy (Rubin Observatory overview).
|
asas-sn_g, asas-sn_V |
ASAS-SN g, ASAS-SN V |
ASAS-SN Sky Patrol g band and Johnson
V band photometry (Sky Patrol documentation).
|
aavso_B, aavso_V,
aavso_R, aavso_I
|
AAVSO B, AAVSO V,
AAVSO R, AAVSO I
|
AAVSO Johnson/Cousins B, V,
R, and I bands (AAVSO filter table).
|
aavso_CV, aavso_CR |
AAVSO CV, AAVSO CR |
Clear or unfiltered AAVSO measurements reduced to a
V or R comparison sequence; these
are not identical to standard filtered V or
R measurements (AAVSO band abbreviations).
|
aavso_Vis., aavso_U,
aavso_TB, aavso_TG,
aavso_TR, aavso_SU,
aavso_SG, aavso_SR,
aavso_SI, aavso_SZ
|
AAVSO Vis., AAVSO U,
AAVSO TB, AAVSO TG,
AAVSO TR, AAVSO SU,
AAVSO SG, AAVSO SR,
AAVSO SI, AAVSO SZ
|
Other AAVSO filters and visual estimates. They are only included when the customized lightcurve request enables all AAVSO filters (AAVSO band abbreviations). |
rapas_A/G, rapas_B/Gbp,
rapas_C/Grp
|
RAPAS A/G, RAPAS B/Gbp,
RAPAS C/Grp
|
RAPAS internal labels associated with Gaia-like
G, Gbp, and
Grp photometric bands (Gaia passband documentation).
|
RAPAS observations
Observations performed by members of the RAPAS network of amateur astronomers are available for download in the exact same format as the photometric data used to generate the lightcurve figure.Members of the RAPAS network of amateur astronomers can request access to additional features within Astro-COLIBRI. These features include the possibility to submit new targets for observations by the members of the network. A description on how to request access can be found in this YouTube tutorial (in French).