Introduction
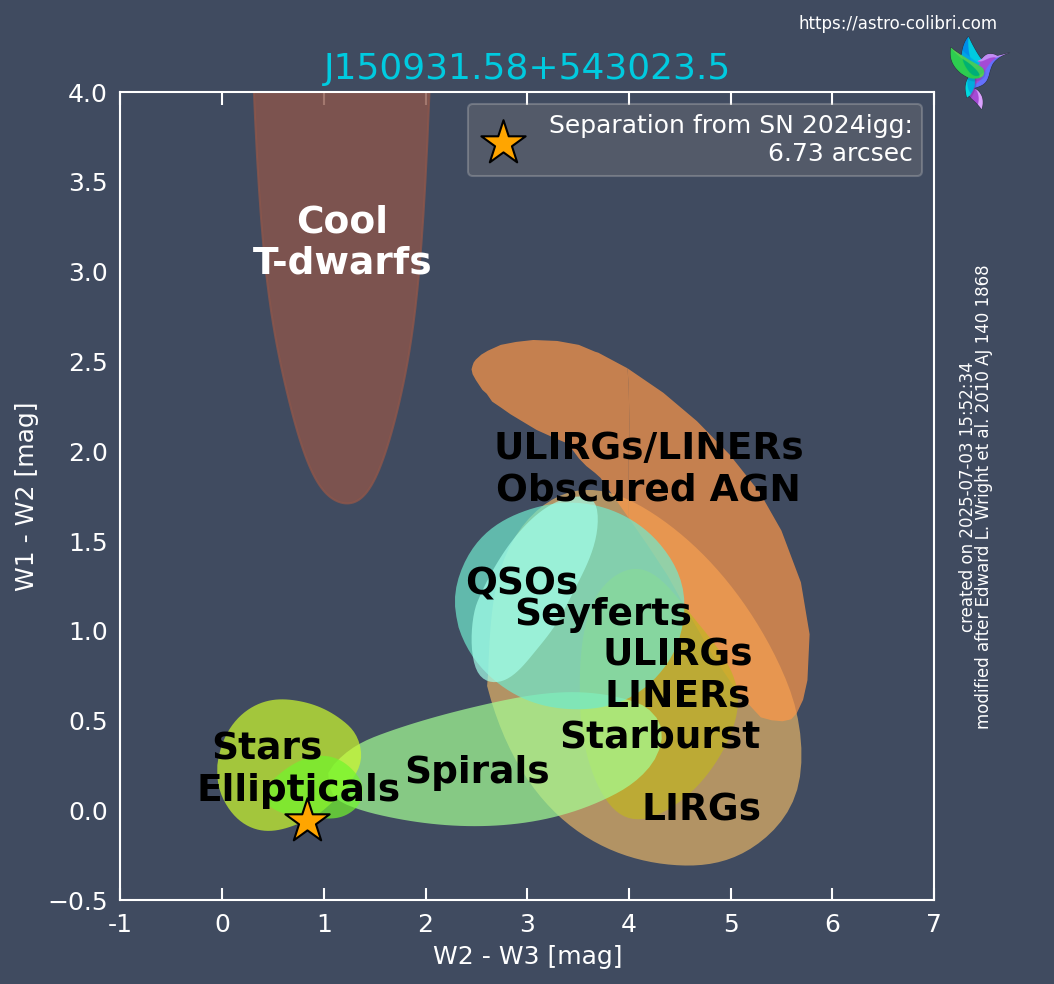
The WISE color-color diagram is a graphical representation of the infrared colors of astronomical objects, specifically using data from the Wide-field Infrared Survey Explorer (WISE) satellite. The WISE color-color diagram is a powerful diagnostic tool used to classify astronomical sources based on their infrared properties, particularly useful for identifying the nature of galaxies, active galactic nuclei (AGN), and stellar populations. Built using infrared photometry from the WISE satellite, it plots the color indices W2−W3 and W1−W2, which are sensitive to different physical processes such as dust emission, star formation, and AGN activity. By comparing the location of a source in this diagram to the empirical regions defined in previous studies (e.g., Wright et al. (2010)), astronomers can infer the likely nature of the host galaxy of a newly detected transient phenomena. This diagram therefore provides a quick visual classification method, particularly useful for selection and classification of transients based on the properties of their host galaxies.Catalog query
Based on the query parameter given, the following catalogs and data bases are queried:- VizieR (Default): AllWISE Data Release (Cutrie et al. 2013) from the VizieR data base. See Catalog documentation here.
- 100 largest galaxies: WISE Extended Source Catalog (WXSC) (Jarrett et al. 2019) from the VizieR data base. See Catalog documentation here.
- IRSA: AllWISE Data Release (Wright et al. 2010) from the NASA/IPAC Infrared Science Archive. See Catalog documentation here.
- IRSA Astroquery: AllWISE Source Catalog (Wright et al. 2010) using Astroquery. See Catalog documentation here.
The AllWISE Data Release and AllWISE Data Release contain the same catalog entries, but are queried from different data bases. Either the trigger_id, for transient events, or the catalog_name, for stationary/catalog events, have to be provided for the query. Given the sky location (in ra/dec), we perform a cone search around the event in the respective catalog and retrieve all entries inside the cone search. For each catalog entry, we calculate the separation from the given sky location and take the entry, which is the closest to the given coordinates. The only difference is with the query for "100 largest galaxies". Then, the catalog entry is searched by name in the WISE Extended Source Catalog (WXSC): The default query is "vizier". If the catalog should be inaccessible, the "IRSA" query serves as a default fail-safe, but can also be queried manually.
Plot Creation
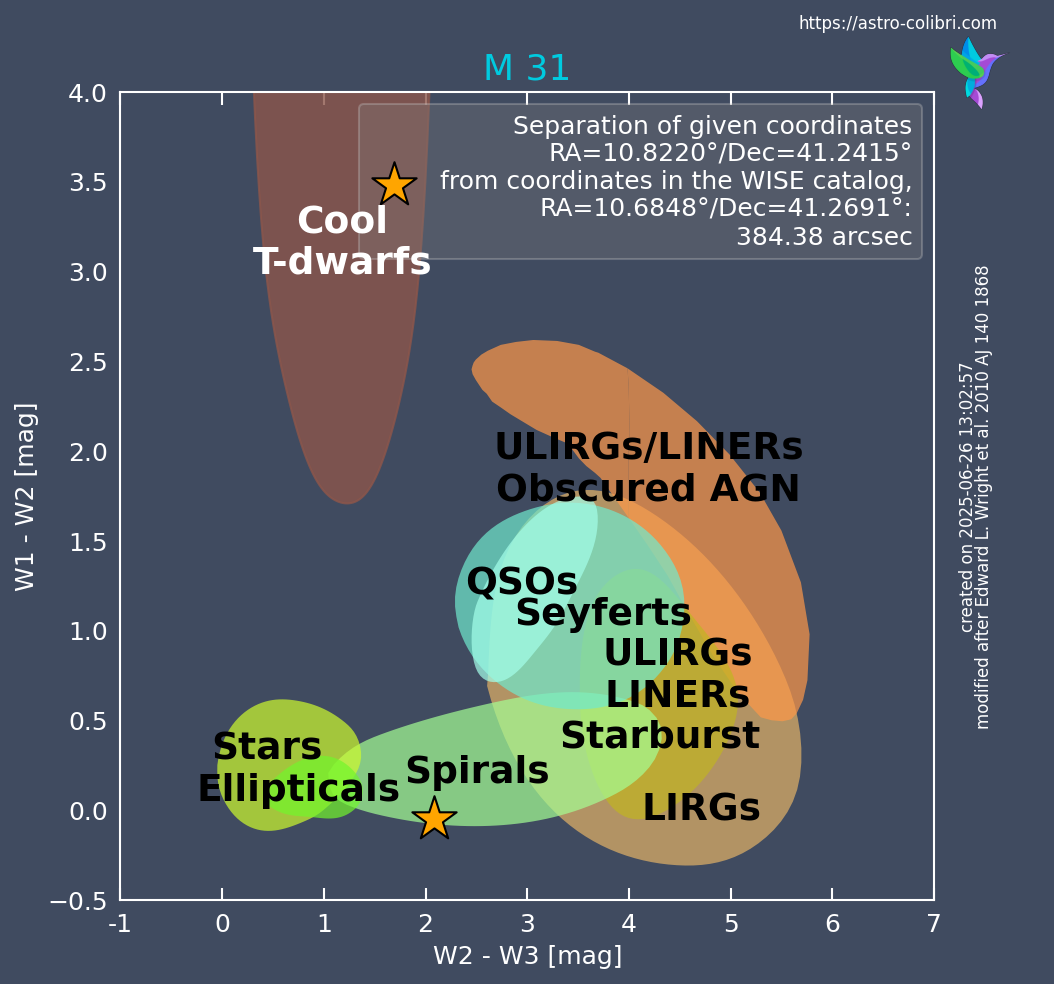
The W1 [3.4 μm], W2 [4.6 μm] and W3 [12 μm] infrared bands are retrieved for the entry found from the respective catalog. They are used to create the WISE color color diagram with W2-W3 on the x-axis and W1-W2 on the y-axis. Note that the values contain errors, which are not visible in the diagram. The background follows the categorization made in Wright et al. (2010). The title of the figure is always the catalog name of the closest entry in the WISE catalogs to the coordinates given, shown as a yellow star in the diagram. Was the trigger_id given as input, then the respective transient name is shown in the legend as well as its separation in arcsec from the closest WISE entry. Was instead a catalog_name queried, and is not among these galaxies, then the ra/dec coordinates and its separation in arcsec from the closest WISE entry are shown as well. However, if the catalog_name is among the 100 largest galaxies in the sky (according to Jarrett et al. 2019), then the catalog_name appears in the figure title and the separation of the given coordinates of the source to its coordinates in the WISE Extended Source Catalog (WXSC) are given.Examples of the WISE color color diagram for a transient event and a catalog event are shown here:
Users can create a WISE color color diagram by opening the small menu indicated by the downward facing arrow next to "host galaxy (WISE)" (in Science mode).